springboot集成prometheus监控
pom.xml引入acturator和prometheus。这里使用springboot 2.2.4。
<dependency>
    <groupId>org.springframework.boot</groupId>
    <artifactId>spring-boot-starter-actuator</artifactId>
</dependency>

<dependency>
    <groupId>io.micrometer</groupId>
    <artifactId>micrometer-registry-prometheus</artifactId>
    <version>1.3.3</version>
</dependency>
隐式导入
  <dependencies>
    <dependency>
      <groupId>io.micrometer</groupId>
      <artifactId>micrometer-core</artifactId>
      <version>1.3.3</version>
      <scope>compile</scope>
    </dependency>
    <dependency>
      <groupId>io.prometheus</groupId>
      <artifactId>simpleclient_common</artifactId>
      <version>0.7.0</version>
      <scope>compile</scope>
    </dependency>
  </dependencies>
application.yml打开endpoints和metrics:
management:
  endpoints:
    web:
      exposure:
        include: "*"

  metrics:
    tags:
      application: ${spring.application.name}
java config
@Bean
MeterRegistryCustomizer<MeterRegistry> configurer(
        @Value("${spring.application.name}") String applicationName) {
    return (registry) -> registry.config().commonTags("application", applicationName);
}
打开http://localhost:8080/actuator/prometheus
# HELP jvm_threads_states_threads The current number of threads having NEW state
# TYPE jvm_threads_states_threads gauge
jvm_threads_states_threads{application="springboot_prometheus",state="blocked",} 0.0
jvm_threads_states_threads{application="springboot_prometheus",state="waiting",} 12.0
jvm_threads_states_threads{application="springboot_prometheus",state="timed-waiting",} 7.0
jvm_threads_states_threads{application="springboot_prometheus",state="runnable",} 10.0
jvm_threads_states_threads{application="springboot_prometheus",state="new",} 0.0
jvm_threads_states_threads{application="springboot_prometheus",state="terminated",} 0.0
# HELP system_cpu_usage The "recent cpu usage" for the whole system
# TYPE system_cpu_usage gauge
system_cpu_usage{application="springboot_prometheus",} 0.0
# HELP tomcat_sessions_active_current_sessions
# TYPE tomcat_sessions_active_current_sessions gauge
tomcat_sessions_active_current_sessions{application="springboot_prometheus",} 0.0
# HELP process_start_time_seconds Start time of the process since unix epoch.
# TYPE process_start_time_seconds gauge
process_start_time_seconds{application="springboot_prometheus",} 1.579920932014E9
# HELP tomcat_sessions_expired_sessions_total
# TYPE tomcat_sessions_expired_sessions_total counter
tomcat_sessions_expired_sessions_total{application="springboot_prometheus",} 0.0
# HELP process_cpu_usage The "recent cpu usage" for the Java Virtual Machine process
# TYPE process_cpu_usage gauge
process_cpu_usage{application="springboot_prometheus",} 0.10879525186187843
# HELP jvm_gc_pause_seconds Time spent in GC pause
# TYPE jvm_gc_pause_seconds summary
jvm_gc_pause_seconds_count{action="end of major GC",application="springboot_prometheus",cause="Metadata GC Threshold",} 1.0
jvm_gc_pause_seconds_sum{action="end of major GC",application="springboot_prometheus",cause="Metadata GC Threshold",} 0.039
jvm_gc_pause_seconds_count{action="end of minor GC",application="springboot_prometheus",cause="Metadata GC Threshold",} 1.0
jvm_gc_pause_seconds_sum{action="end of minor GC",application="springboot_prometheus",cause="Metadata GC Threshold",} 0.006
jvm_gc_pause_seconds_count{action="end of minor GC",application="springboot_prometheus",cause="Allocation Failure",} 1.0
jvm_gc_pause_seconds_sum{action="end of minor GC",application="springboot_prometheus",cause="Allocation Failure",} 0.011
# HELP jvm_gc_pause_seconds_max Time spent in GC pause
# TYPE jvm_gc_pause_seconds_max gauge
jvm_gc_pause_seconds_max{action="end of major GC",application="springboot_prometheus",cause="Metadata GC Threshold",} 0.039
jvm_gc_pause_seconds_max{action="end of minor GC",application="springboot_prometheus",cause="Metadata GC Threshold",} 0.006
jvm_gc_pause_seconds_max{action="end of minor GC",application="springboot_prometheus",cause="Allocation Failure",} 0.011
# HELP jvm_buffer_total_capacity_bytes An estimate of the total capacity of the buffers in this pool
# TYPE jvm_buffer_total_capacity_bytes gauge
jvm_buffer_total_capacity_bytes{application="springboot_prometheus",id="direct",} 57344.0
jvm_buffer_total_capacity_bytes{application="springboot_prometheus",id="mapped",} 0.0
# HELP jvm_memory_max_bytes The maximum amount of memory in bytes that can be used for memory management
# TYPE jvm_memory_max_bytes gauge
jvm_memory_max_bytes{application="springboot_prometheus",area="heap",id="PS Survivor Space",} 1.6777216E7
jvm_memory_max_bytes{application="springboot_prometheus",area="heap",id="PS Old Gen",} 2.82591232E9
jvm_memory_max_bytes{application="springboot_prometheus",area="nonheap",id="Code Cache",} 2.5165824E8
jvm_memory_max_bytes{application="springboot_prometheus",area="heap",id="PS Eden Space",} 1.379926016E9
jvm_memory_max_bytes{application="springboot_prometheus",area="nonheap",id="Compressed Class Space",} 1.073741824E9
jvm_memory_max_bytes{application="springboot_prometheus",area="nonheap",id="Metaspace",} -1.0
# HELP jvm_buffer_count_buffers An estimate of the number of buffers in the pool
# TYPE jvm_buffer_count_buffers gauge
jvm_buffer_count_buffers{application="springboot_prometheus",id="direct",} 7.0
jvm_buffer_count_buffers{application="springboot_prometheus",id="mapped",} 0.0
# HELP jvm_threads_peak_threads The peak live thread count since the Java virtual machine started or peak was reset
# TYPE jvm_threads_peak_threads gauge
jvm_threads_peak_threads{application="springboot_prometheus",} 30.0
# HELP jvm_threads_daemon_threads The current number of live daemon threads
# TYPE jvm_threads_daemon_threads gauge
jvm_threads_daemon_threads{application="springboot_prometheus",} 25.0
# HELP tomcat_sessions_rejected_sessions_total
# TYPE tomcat_sessions_rejected_sessions_total counter
tomcat_sessions_rejected_sessions_total{application="springboot_prometheus",} 0.0
# HELP jvm_classes_unloaded_classes_total The total number of classes unloaded since the Java virtual machine has started execution
# TYPE jvm_classes_unloaded_classes_total counter
jvm_classes_unloaded_classes_total{application="springboot_prometheus",} 1.0
# HELP jvm_threads_live_threads The current number of live threads including both daemon and non-daemon threads
# TYPE jvm_threads_live_threads gauge
jvm_threads_live_threads{application="springboot_prometheus",} 29.0
# HELP jvm_classes_loaded_classes The number of classes that are currently loaded in the Java virtual machine
# TYPE jvm_classes_loaded_classes gauge
jvm_classes_loaded_classes{application="springboot_prometheus",} 7733.0
# HELP tomcat_sessions_alive_max_seconds
# TYPE tomcat_sessions_alive_max_seconds gauge
tomcat_sessions_alive_max_seconds{application="springboot_prometheus",} 0.0
# HELP jvm_memory_committed_bytes The amount of memory in bytes that is committed for the Java virtual machine to use
# TYPE jvm_memory_committed_bytes gauge
jvm_memory_committed_bytes{application="springboot_prometheus",area="heap",id="PS Survivor Space",} 1.6777216E7
jvm_memory_committed_bytes{application="springboot_prometheus",area="heap",id="PS Old Gen",} 1.09051904E8
jvm_memory_committed_bytes{application="springboot_prometheus",area="nonheap",id="Code Cache",} 7340032.0
jvm_memory_committed_bytes{application="springboot_prometheus",area="heap",id="PS Eden Space",} 2.31211008E8
jvm_memory_committed_bytes{application="springboot_prometheus",area="nonheap",id="Compressed Class Space",} 5767168.0
jvm_memory_committed_bytes{application="springboot_prometheus",area="nonheap",id="Metaspace",} 4.0108032E7
# HELP jvm_gc_memory_promoted_bytes_total Count of positive increases in the size of the old generation memory pool before GC to after GC
# TYPE jvm_gc_memory_promoted_bytes_total counter
jvm_gc_memory_promoted_bytes_total{application="springboot_prometheus",} 8487008.0
# HELP logback_events_total Number of error level events that made it to the logs
# TYPE logback_events_total counter
logback_events_total{application="springboot_prometheus",level="error",} 0.0
logback_events_total{application="springboot_prometheus",level="debug",} 0.0
logback_events_total{application="springboot_prometheus",level="trace",} 0.0
logback_events_total{application="springboot_prometheus",level="warn",} 0.0
logback_events_total{application="springboot_prometheus",level="info",} 8.0
# HELP system_cpu_count The number of processors available to the Java virtual machine
# TYPE system_cpu_count gauge
system_cpu_count{application="springboot_prometheus",} 8.0
# HELP http_server_requests_seconds
# TYPE http_server_requests_seconds summary
http_server_requests_seconds_count{application="springboot_prometheus",exception="None",method="GET",outcome="CLIENT_ERROR",status="404",uri="/**",} 3.0
http_server_requests_seconds_sum{application="springboot_prometheus",exception="None",method="GET",outcome="CLIENT_ERROR",status="404",uri="/**",} 0.0249087
# HELP http_server_requests_seconds_max
# TYPE http_server_requests_seconds_max gauge
http_server_requests_seconds_max{application="springboot_prometheus",exception="None",method="GET",outcome="CLIENT_ERROR",status="404",uri="/**",} 0.0173263
# HELP jvm_gc_memory_allocated_bytes_total Incremented for an increase in the size of the young generation memory pool after one GC to before the next
# TYPE jvm_gc_memory_allocated_bytes_total counter
jvm_gc_memory_allocated_bytes_total{application="springboot_prometheus",} 1.43200936E8
# HELP jvm_memory_used_bytes The amount of used memory
# TYPE jvm_memory_used_bytes gauge
jvm_memory_used_bytes{application="springboot_prometheus",area="heap",id="PS Survivor Space",} 0.0
jvm_memory_used_bytes{application="springboot_prometheus",area="heap",id="PS Old Gen",} 1.3831144E7
jvm_memory_used_bytes{application="springboot_prometheus",area="nonheap",id="Code Cache",} 7314112.0
jvm_memory_used_bytes{application="springboot_prometheus",area="heap",id="PS Eden Space",} 6.7909056E7
jvm_memory_used_bytes{application="springboot_prometheus",area="nonheap",id="Compressed Class Space",} 5190968.0
jvm_memory_used_bytes{application="springboot_prometheus",area="nonheap",id="Metaspace",} 3.7164888E7
# HELP jvm_gc_max_data_size_bytes Max size of old generation memory pool
# TYPE jvm_gc_max_data_size_bytes gauge
jvm_gc_max_data_size_bytes{application="springboot_prometheus",} 2.82591232E9
# HELP process_uptime_seconds The uptime of the Java virtual machine
# TYPE process_uptime_seconds gauge
process_uptime_seconds{application="springboot_prometheus",} 64.781
# HELP jvm_gc_live_data_size_bytes Size of old generation memory pool after a full GC
# TYPE jvm_gc_live_data_size_bytes gauge
jvm_gc_live_data_size_bytes{application="springboot_prometheus",} 1.3831144E7
# HELP tomcat_sessions_created_sessions_total
# TYPE tomcat_sessions_created_sessions_total counter
tomcat_sessions_created_sessions_total{application="springboot_prometheus",} 0.0
# HELP jvm_buffer_memory_used_bytes An estimate of the memory that the Java virtual machine is using for this buffer pool
# TYPE jvm_buffer_memory_used_bytes gauge
jvm_buffer_memory_used_bytes{application="springboot_prometheus",id="direct",} 57344.0
jvm_buffer_memory_used_bytes{application="springboot_prometheus",id="mapped",} 0.0
# HELP tomcat_sessions_active_max_sessions
# TYPE tomcat_sessions_active_max_sessions gauge
tomcat_sessions_active_max_sessions{application="springboot_prometheus",} 0.0
更新Prometheus配置文件,增加job
# my global config
global:
  scrape_interval:     15s # Set the scrape interval to every 15 seconds. Default is every 1 minute.
  evaluation_interval: 15s # Evaluate rules every 15 seconds. The default is every 1 minute.
  # scrape_timeout is set to the global default (10s).

# Alertmanager configuration
alerting:
  alertmanagers:
  - static_configs:
    - targets:
      # - alertmanager:9093

# Load rules once and periodically evaluate them according to the global 'evaluation_interval'.
rule_files:
  # - "first_rules.yml"
  # - "second_rules.yml"

# A scrape configuration containing exactly one endpoint to scrape:
# Here it's Prometheus itself.
scrape_configs:
  # The job name is added as a label `job=<job_name>` to any timeseries scraped from this config.
  - job_name: 'prometheus'

    # metrics_path defaults to '/metrics'
    # scheme defaults to 'http'.

    static_configs:
    - targets: ['localhost:9090']

  - job_name: 'springboot_prometheus'
    scrape_interval: 5s
    metrics_path: '/actuator/prometheus'
    static_configs:
      - targets: ['127.0.0.1:8080']
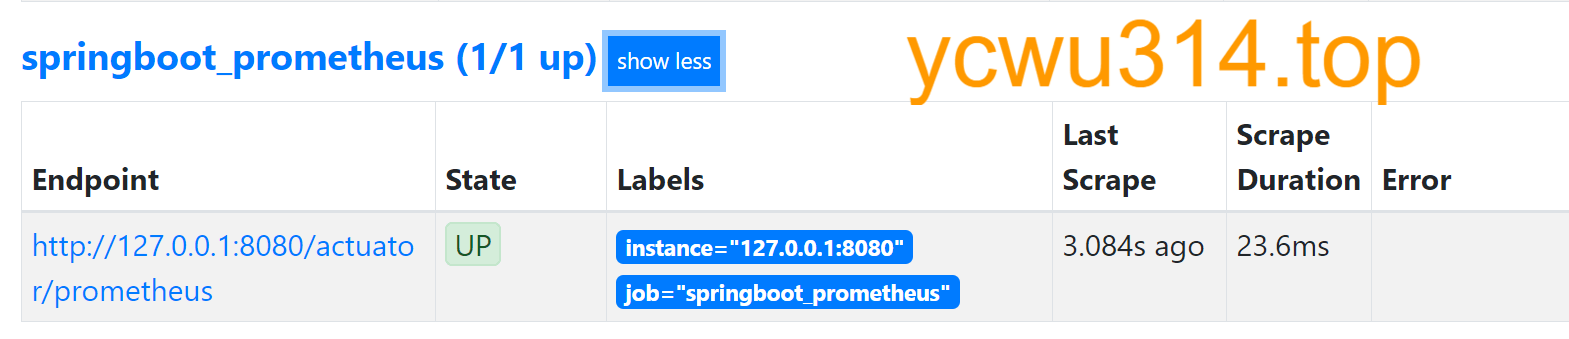
打开localhost:9090,status=》target
Prometheus metrics 自动配置
PrometheusMetricsExportAutoConfiguration自动配置prometheus metrics。
package org.springframework.boot.actuate.autoconfigure.metrics.export.prometheus;

@Configuration(proxyBeanMethods = false)
@AutoConfigureBefore({ CompositeMeterRegistryAutoConfiguration.class, SimpleMetricsExportAutoConfiguration.class })
@AutoConfigureAfter(MetricsAutoConfiguration.class)
@ConditionalOnBean(Clock.class)
@ConditionalOnClass(PrometheusMeterRegistry.class)
@ConditionalOnProperty(prefix = "management.metrics.export.prometheus", name = "enabled", havingValue = "true",
		matchIfMissing = true)
@EnableConfigurationProperties(PrometheusProperties.class)
public class PrometheusMetricsExportAutoConfiguration {
}
很简单,不展开了。
micrometer metric types
micrometer 定义的metric类型在io.micrometer.core.instrument.Meter
enum Type {
    COUNTER,
    GAUGE,
    LONG_TASK_TIMER,
    TIMER,
    DISTRIBUTION_SUMMARY,
    OTHER;
}
原生Prometheus client定义metric类型在io.prometheus.client.Collector
public enum Type {
  COUNTER,
  GAUGE,
  SUMMARY,
  HISTOGRAM,
  UNTYPED,
}
二者的类型不是一一对应。micrometer的metric类型和Prometheus在PrometheusMeterRegistry中进行映射:
    protected Meter newMeter(Meter.Id id, Meter.Type type, Iterable<Measurement> measurements) {
        Collector.Type promType = Collector.Type.UNTYPED;
        switch (type) {
            case COUNTER:
                promType = Collector.Type.COUNTER;
                break;
            case GAUGE:
                promType = Collector.Type.GAUGE;
                break;
            case DISTRIBUTION_SUMMARY:
            case TIMER:
                promType = Collector.Type.SUMMARY;
                break;
        }

        MicrometerCollector collector = collectorByName(id);
        List<String> tagValues = tagValues(id);

        // more codes
    }
注意,micrometer的timer对应Prometheus的histogram,但是映射为Prometheus的summary类型。